

Businesses and organizations depend on valuable insights to make informed decisions in today’s data-driven world. Microsoft Power BI is a powerful tool that empowers users to transform data into meaningful information, offering a comprehensive data analysis and visualization solution. Whether you’re a business professional, analyst, or data enthusiast, Microsoft Power BI is a game-changer in data analytics. In this blog, we’ll dive into the world of Microsoft Power BI and explore what makes it such a vital tool for modern data analysis.
What is Power BI?
Microsoft Power BI is a powerful business intelligence toolset that helps organizations collate, manage, and analyze data from various sources through a user-friendly interface. There is a multitude of purposes that business intelligence tools are used for.
Power BI primarily collects data, processes it, and turns it into actionable insights. It allows users to generate and share clear and valuable snapshots of what’s happening in their business. Power BI connects to various data sources, from basic Excel spreadsheets to databases and cloud-based and on-premises apps.
Power BI can be defined as an umbrella term; it can either be referred to as Power BI Desktop, an online SaaS (Software as a Service) service called Power BI Service, or mobile Power BI apps available on Windows phones and tablets, as well as for iOS and Android devices.
It is important to remember that Power BI is built on the foundation of Microsoft Excel. That is why anyone using Excel can use Power BI, but the latter is way more potent than its counterpart.
Why We Use Power BI?
These are the most popular reasons for using Power BI tools:
- Microsoft Power BI is used to run reports and surface insights
- Power BI enables real-time dashboard updates
- Pre-built dashboards for SaaS solutions
- Spot patterns in data and use those patterns to make informed predictions
- Power BI offers quick deployment, hybrid configuration, and a secure environment
- Offers secure and reliable connections to your data sources in the cloud
- Allow users to generate forecasts and prepare themselves to meet future demand
- Enables data expedition using natural language query
Key Components of Power BI
The major building blocks of Power BI are:
- Visualizations
- Datasets
- Reports
- Dashboards
- Tiles
All are created on capacities and organized into workspaces.
Types of Power BI Tools
Some important Power BI tools are:
Power BI Desktop
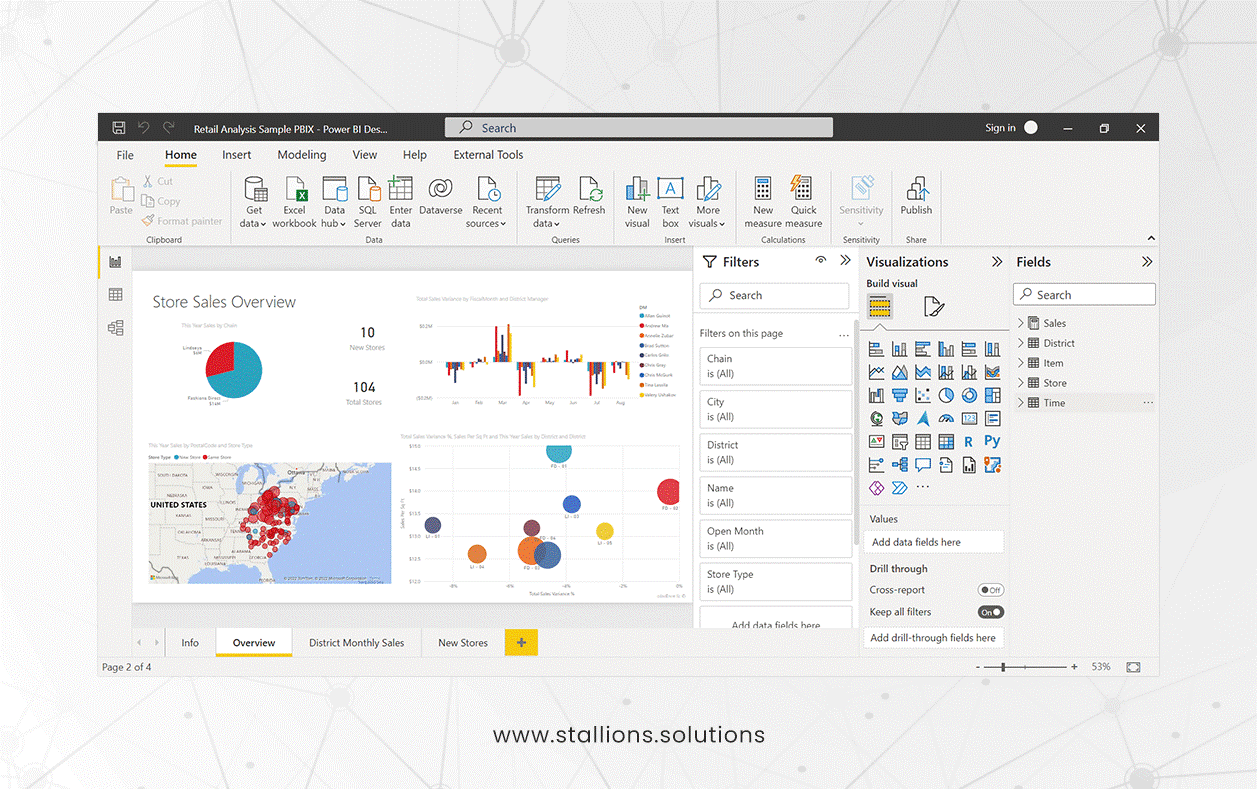
It is a free desktop application that works cohesively with the Power BI service to provide advanced data exploration, shaping, modeling, and report creation with highly interactive visualization. You can then share your data and reports to your Power BI site to share with others.
Power BI Desktop allows you to connect to data sources to Power BI with no limits or restrictions other than the total amount of data you can feed in and how much you can upload at a time. Most importantly, you can share anything with your peers with Power BI Desktop.
Power BI Service
Power BI Service (usually known simply as Power BI) is the full version of Power BI. Power BI service is a secure Microsoft-hosted cloud service that lets users view dashboards, reports, and Power BI apps – a type of content that combines related dashboards and reports – using a web browser or via mobile apps for Windows, iOS, and Android.
Power BI Pro and Power BI Premium are two ways to license Power BI Service.
Power BI Pro
Power BI Pro and Power BI desktop have certain similarities. They have the same visualization options, storage and file upload size limits, and report refresh allowance. The major difference is that you can share your data, reports, and dashboard with others privately with Power BI Pro.
Moreover, you can create app workspaces with Power BI Pro, where you can assemble related dashboards and reports.
Power BI Premium
It is an alternate way to access Power BI. Unlike with Power BI Pro, you can pay for the space and processing capacity you want to carve out for your business. There are six capacity models, each with varying amounts of memory, so users can choose the amount they need to run their Power BI platform.
Premium is intended for enterprise-level businesses that generate huge amounts of data and require extensive access to the app.
Power BI Report Server
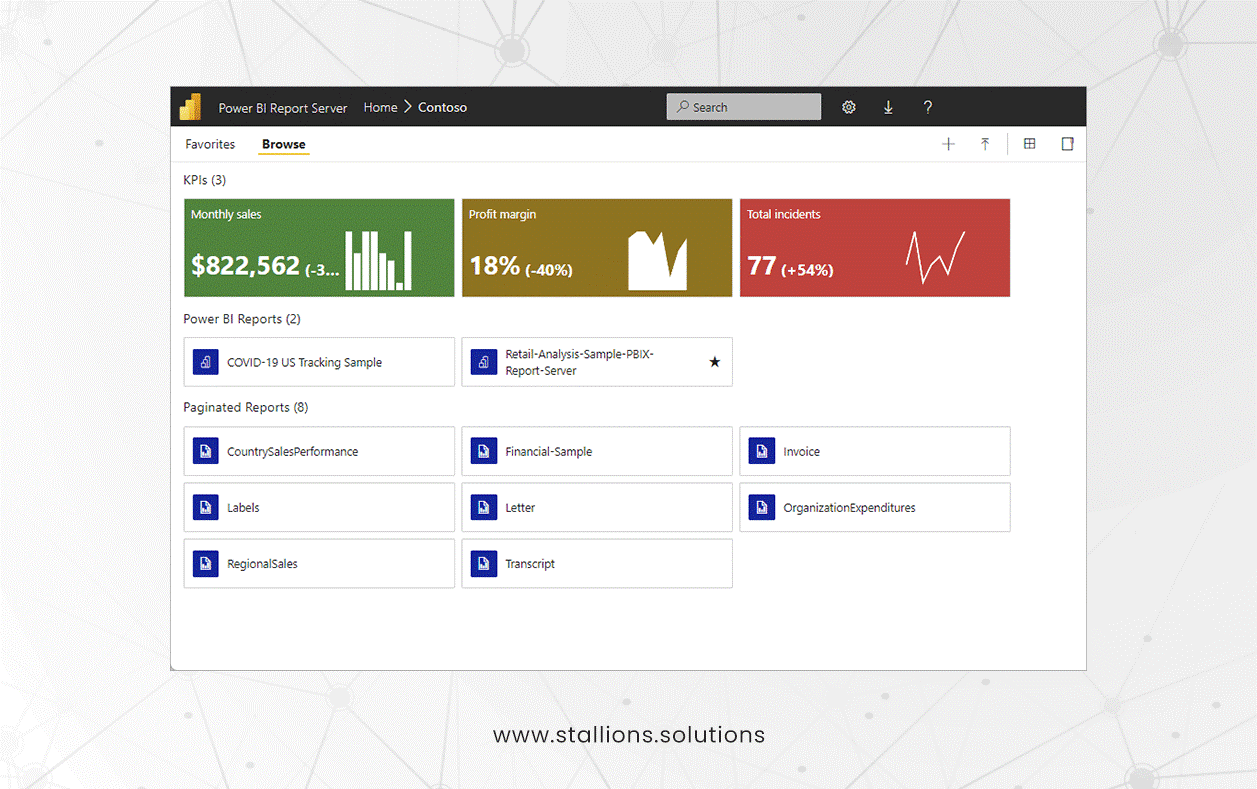
Power BI Report Server is an on-premises report server that hosts Power BI reports. The reports hosted on the on-premises report server are displayed to the users via a web portal. It has numerous advantages.
It is compatible with the Power BI Service, and you can easily integrate it with your existing Reporting Services. Also, an on-premises report server is preferred by many organizations from a security point of view. It is safe to host essential reports on a secure on-premises solution.
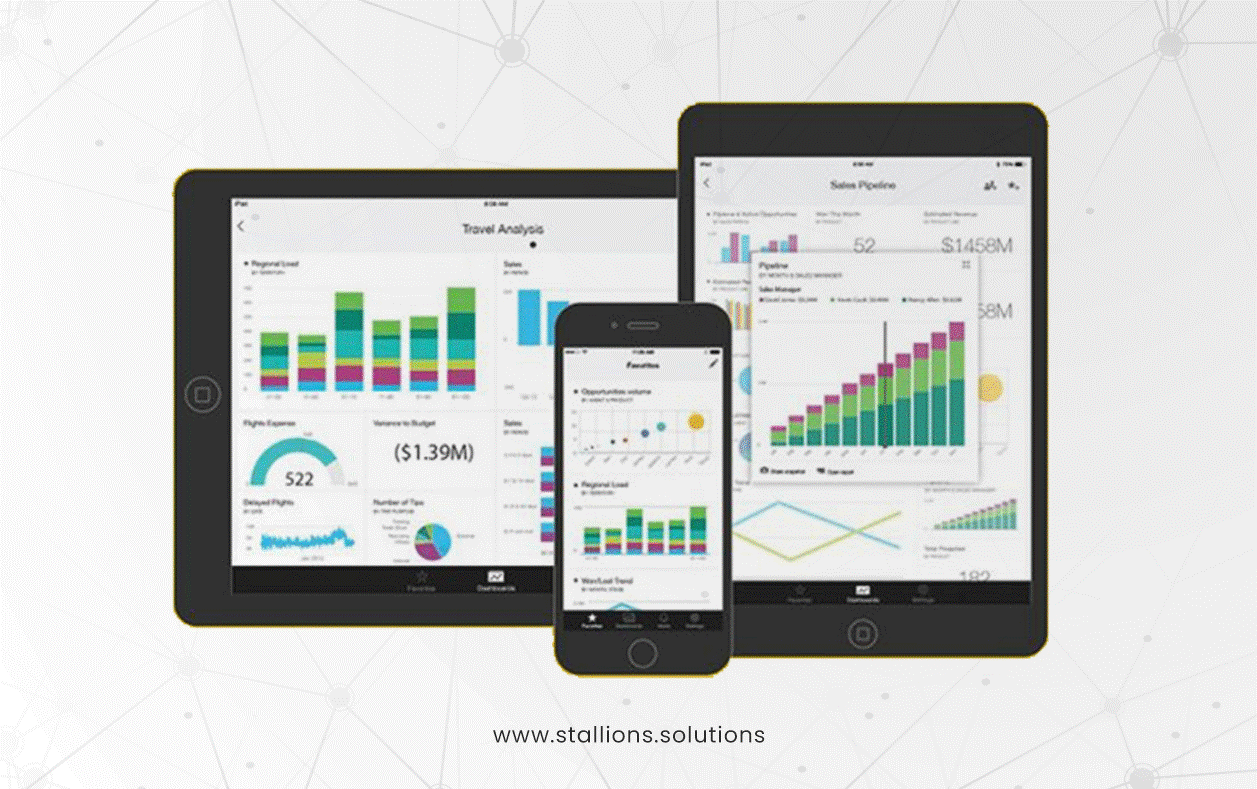
Power BI Mobile Apps

These are applications for your mobile and tablet devices that allow you to view your Power BI reports and dashboards. You can connect your data, make insights, collaborate, and get notified when your data is changed. Power BI mobile apps allow you to consume your data. However, you cannot create or edit reports.
Using tabs, you can quickly navigate from different workspaces, reports, and dashboards. You can interact with your Power BI reports by clicking on other visuals or using slicers to filter the data.
Final Words
Power BI is a robust suite of business intelligence tools that enables businesses to gather, organize, and analyze data from diverse sources. If you’re considering implementing the Power Platform in your company, don’t hesitate to contact Stallions Solutions. Leveraging our extensive expertise in the Microsoft ecosystem, we create tailored solutions to perfectly align with your specific requirements.