
For businesses, the ability to make decisions based on real-time data can be the difference between taking and missing out on market choices. Many daily reports and dashboards can be delivered with traditional Business Intelligence (BI) systems depend on regular information updates. However, more than simple data updating is required to meet user demands because of streaming data’s increasing popularity and increasing popularity of streaming data. The increasing client demands for 24-7 interaction.
Microsoft’s dynamic BI and analytics tool, Power BI, was not initially designed for real-time data handling, but it has developed to keep up with the changing business environment. Power BI now provides two solutions for creating real-time reports and dashboards to meet the growing demand for real-time data. These alternatives transform how businesses access and use data, allowing them to gain a competitive advantage by making decisions based on what is happening right now rather than on past events and outdated information. This post will examine how Power BI allows real-time data visualization, leading to quick decision-making.
What is Power BI?
Power BI is a comprehensive set of software services, programs, and connectors that transform various data sources into coherent, engaging, and interactive insights. Power BI provides an easy-to-use interface whether your data is in an Excel spreadsheet or a hybrid of cloud-based and on-premises data centers. It makes connecting to your data sources easier, allowing you to visualize, analyze, and highlight important data. Power BI differentiates itself as it will enable data sharing with specific groups of users or the entire organization, making insights available and usable to anybody who needs them. It helps businesses make data-driven decisions and allows simple deployment without requiring major initial investments.
Power BI’s Role in Decision-Making
The importance of live insights within Power BI can be seen in the continuously changing dynamics of today’s business world. This is a complex and urgent requirement. For beginnings, live insights allow quick decision-making, giving companies a competitive advantage by enabling them to adapt quickly to changing market trends and operational issues. Furthermore, it improves client experiences through personalized interactions and quick solutions to problems. It is important in industries that depend on the Internet of Things (IoT) and sensor data while improving operational efficiency and encouraging a data-driven organizational culture. Furthermore, real-time insights allow proactive solutions and ongoing healthcare and emergency services monitoring.
Power BI provides two robust solutions for getting real-time insights:
- Real-time data visualization
- Data streaming
Real-Time Data Visualization

With Power BI’s real-time data visualization, you can create dynamic dashboards and reports that change in only a few seconds as new data comes. This function is very useful when you need to monitor data continually and need the most up-to-date information without requiring manual updates. Real-time data visualization is based on techniques such as DirectQuery or live links to data sources, allowing real-time updates.
Use Cases for Real-Time Data Visualization
- Analysis and trading on the stock market, where seconds count.
- Monitoring website traffic in real-time to track customer behavior.
- IoT device tracking allows for real-time monitoring of sensor data.
Data Streaming
Data streaming in Power BI refers to continuously consuming and visualizing real-time data in Power BI reports and dashboards. It allows users to monitor and analyze data as it is generated or updated in real-time, providing immediate insights and the ability to make informed decisions based on the most current information.
Use Cases for Data Streaming
- Monitoring the status and problems of IoT sensors.
- Observing and analyzing social media trends and views as they grow.
- Keeping track of live events such as sports scores or financial market updates.
- Choosing the Best Tool for Your Needs.
Real-time data visualization and streaming provide users with live insights, but the ability to use them depends on your needs. Real-time data visualization is helpful in situations where you need to update visualizations for specific data sources. On the other hand, data streaming is designed for continuous, high-velocity data transfer and real-time monitoring.
Using Power BI to Create Real-time Data Visualisations
Creating real-time data visualizations in Power BI can be described as a journey that includes data preparation and transformation, interactive dashboard design, and seamless real-time data refresh. It enables organizations to make informed decisions as events occur, creating a data-driven environment that values agility and reactivity. Power BI’s real-time data visualization features put you in control of data-driven success, whether you’re tracking live market data, monitoring IoT devices, or analyzing consumer behavior.
Data Preparation and Transformation
Data preparation and transformation are the first steps toward real-time data visualization. Power BI provides robust features for cleaning, shaping, and refining data, regardless of whether it is stored in spreadsheets, databases, or cloud storage. This step ensures that the data you’re working with is correct, consistent, and ready for visualization. With Power BI’s accessible data modeling features, you can build calculated columns, define measures, and establish relationships between tables—all of which set the stage for informative visualizations.
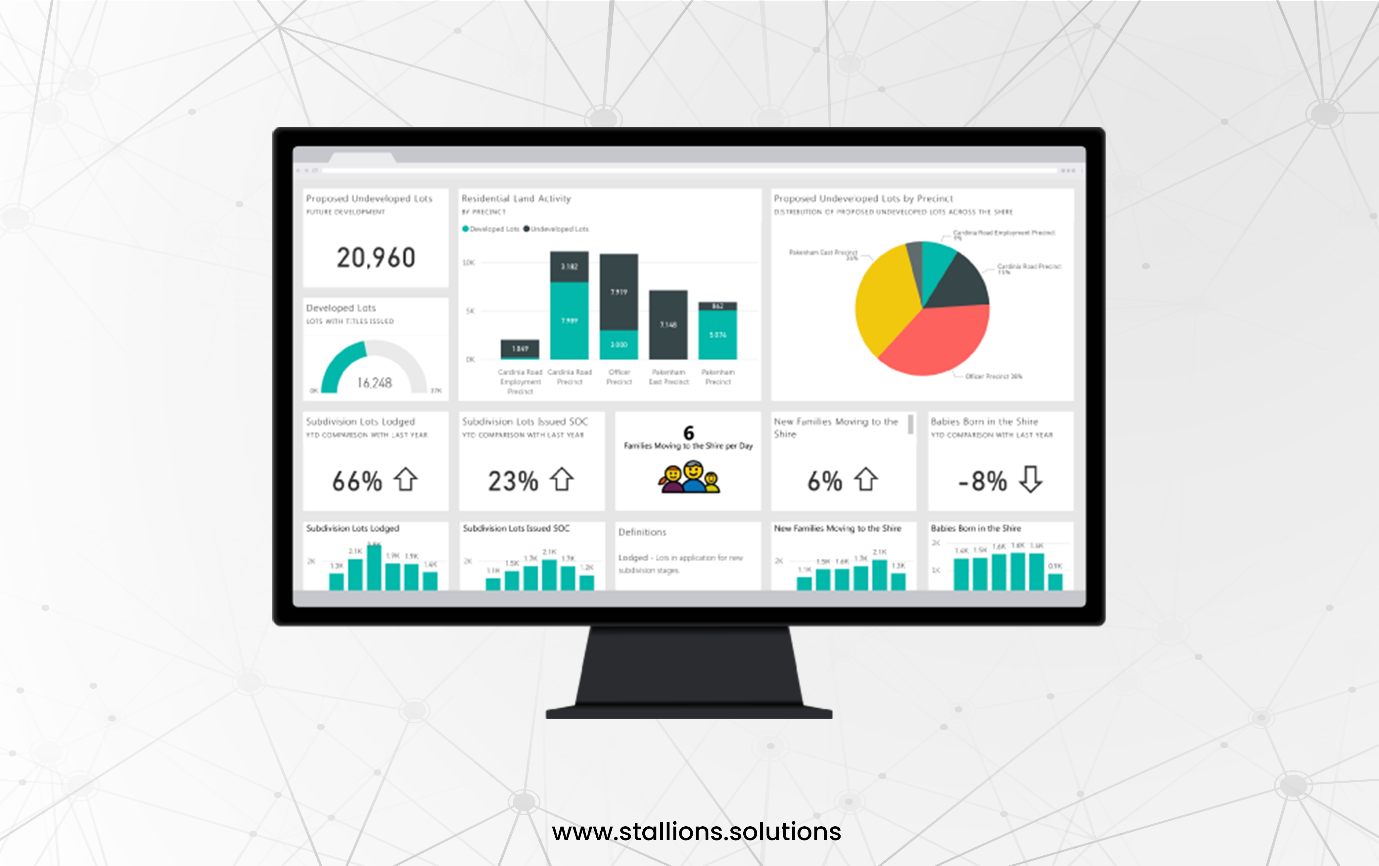
Create Interactive Dashboards
When your data is ready, it’s time to create interactive dashboards. Power BI offers various visualization choices, from simple charts and graphs to complex custom graphics. You may use these graphics to tell a data-driven tale by arranging them in an appealing arrangement. Power BI dashboards are known for their interactivity, which allows users to look into the data, apply filters, and ask random queries. The result is a dynamic dashboard that responds to user input, allowing for a deeper understanding of the data and real-time exploration of insights.
Real-Time Data Refresh
The concept of data refresh brings to life the true magic of real-time data visualization. You can set up automated data refresh schedules in Power BI to ensure that your visualizations always reflect the most up-to-date information. Power BI provides numerous data connection options for real-time applications, such as DirectQuery and live connections, allowing data updates to be reflected in your visualizations without needing additional work. Our real-time data refresh capabilities ensure your insights remain relevant and valuable even in rapidly changing situations.
Set up your Real-time Streaming Dataset with Power BI
In Power BI, setting up a real-time streaming dataset involves creating a dataset that can continuously accept and display data as it arrives. This procedure allows you to monitor and visualize high-speed, real-time data. Here’s how to build up a real-time streaming dataset in Power BI step by step:
Login to your Power BI Account
Make sure that you are logged into your Power BI account.
Access the Power BI Service
Connect to the Power BI service at https://app.powerbi.com/
Choosing a workspace
Choose the workspace in which you want to build the real-time streaming dataset. You can use an existing workspace or create the option of using a current workspace or creating a new one.
Create a Streaming Dataset
Click the “Create” button in the workspace and select “Streaming dataset.”
Select a Data Type
You will be required to select a data type for your streaming dataset; Power BI supports a variety of data types, including “API,” “Streaming dataset,” “Push dataset,” and others. Select “Streaming dataset.”
Define fields
Define your streaming dataset’s fields (columns). These are the fields that will contain the data that you will be streaming. Specify the field names and data types (Text, Number, DateTime) that match your data source.
Create the Dataset
To build the streaming dataset, click the “Create” button.
Obtain the Push URL
After you create the dataset, you will be given a “Push URL.” This URL is the location for data that will be received into the dataset. Maintain the security of this URL, as it allows external sources to push data to your dataset.
Push Data to the Dataset
To send data to the dataset, use the Push URL. This can be done programmatically using scripts, APIs, or data sources. The data should be prepared by the schema you specified before.
Track Data Ingestion
You may view the data ingestion process in real-time as you push data to the dataset. With the new data, Power BI will update the dataset.
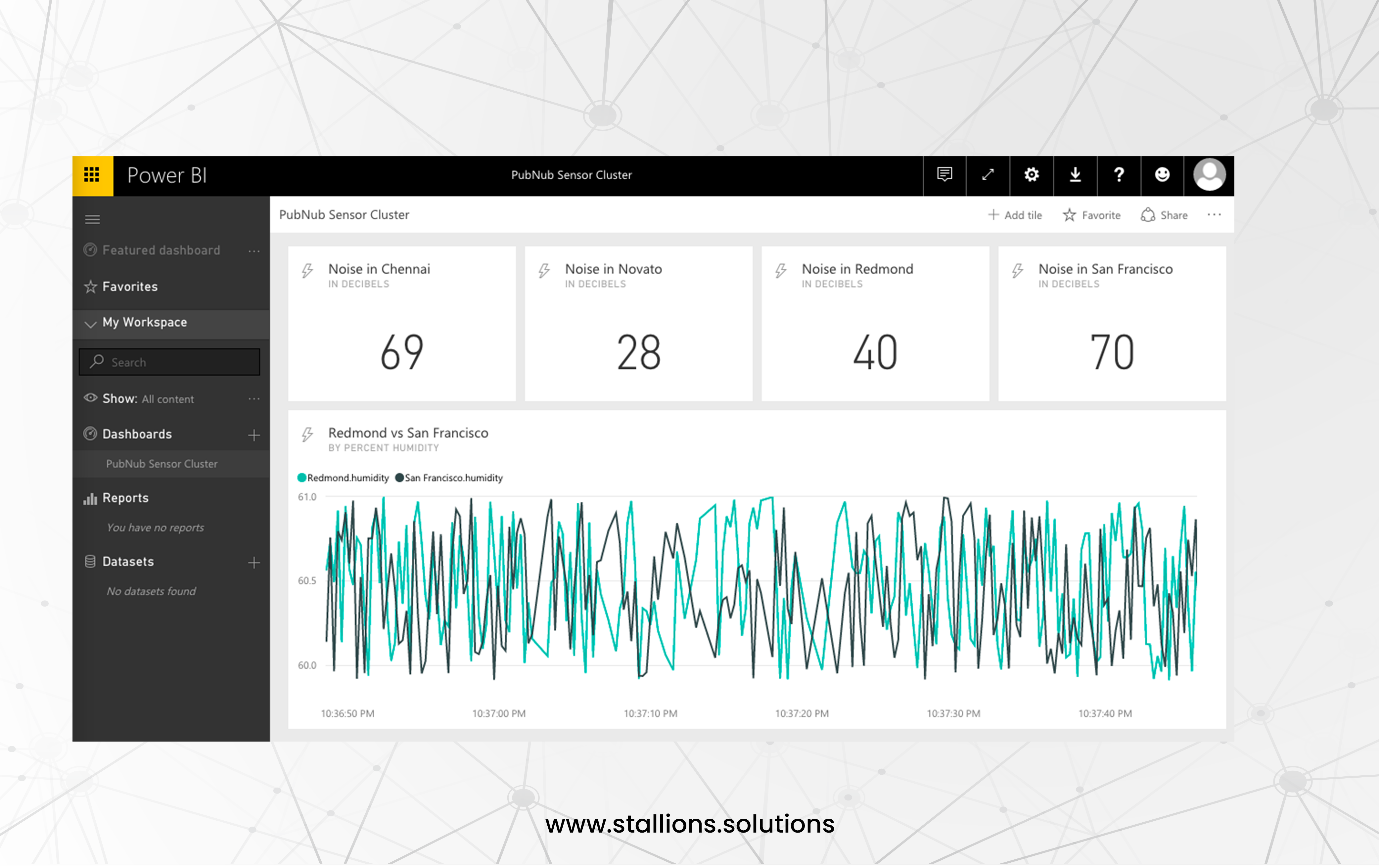
Create Visualizations
Once data flows into the streaming dataset, you can use Power BI Desktop or the Power BI online service to generate visualizations. These visualizations will be updated in real time as new data is received.
Share Real-Time Reports
Share your reports and dashboards with coworkers and external stakeholders. They can view and access real-time data through the Power BI service or mobile app.
Following these steps, you can create a real-time streaming dataset in Power BI to monitor and visualize data as it arrives. This feature is helpful when you must keep up with fast-changing data, such as IoT sensor readings, social media trends, or live event monitoring.
Conclusion
With its powerful real-time data visualization and streaming capabilities, Power BI helps businesses make informed decisions as events happen. Power BI is your most important tool for staying ahead of the curve, whether following live market data, monitoring IoT devices, or analyzing social media trends.
At Stallions, we understand Power BI’s transformational potential and role in developing a data-driven future. Our Power BI services have been designed to help you realize the full potential of this dynamic tool. From data preparation to visualization, real-time streaming, and interactive dashboards, we provide comprehensive dynamic solutions tailored to your requirements.